Accessible Mermaid charts in Github Markdown
by Christina Chortaria, Isha Sinha, Regine Heberlein, and Jane Sandberg
After we saw Github’s announcement about including Mermaid diagrams in markdown files, we started using them extensively! We use these diagrams to confirm understanding with stakeholders, keep our diagrams up-to-date and under source control, and even plan work cycles. Our colleague, Carolyn Cole, gave an excellent talk at RubyConf on how we use Mermaid charts [youtube video with English captions].
As with any complex diagrams, though, it takes some planning to make these charts accessible. If your team doesn’t have the capacity to implement the following pieces, your team may not be ready to use this integration.
Checklist
Every mermaid chart in github markdown should have the following:
- An accessible name, provided by a
titlein the front matter or some other way. - A detailed text description, either outside the chart, or within it and identified by the
accDescrkeyword. - No
themespecified in the%%{init}%%block (otherwise, the chart may be unreadable in dark mode). - If
themeVariablesare specified in the%%{init}%%block, ensure the results have sufficient contrast when dark mode is turned off or on. - If you include multiple mermaid charts in the same page, confirm that they are integrated
into a meaningful heading structure.
Known issues
- Mermaid doesn’t tell assistive technology about the connections between nodes. A screen reader will read a mermaid diagram as a jumble of unrelated text from the diagram. This is why providing a text description of your diagram is very important.
- All Mermaid themes have color contrast issues
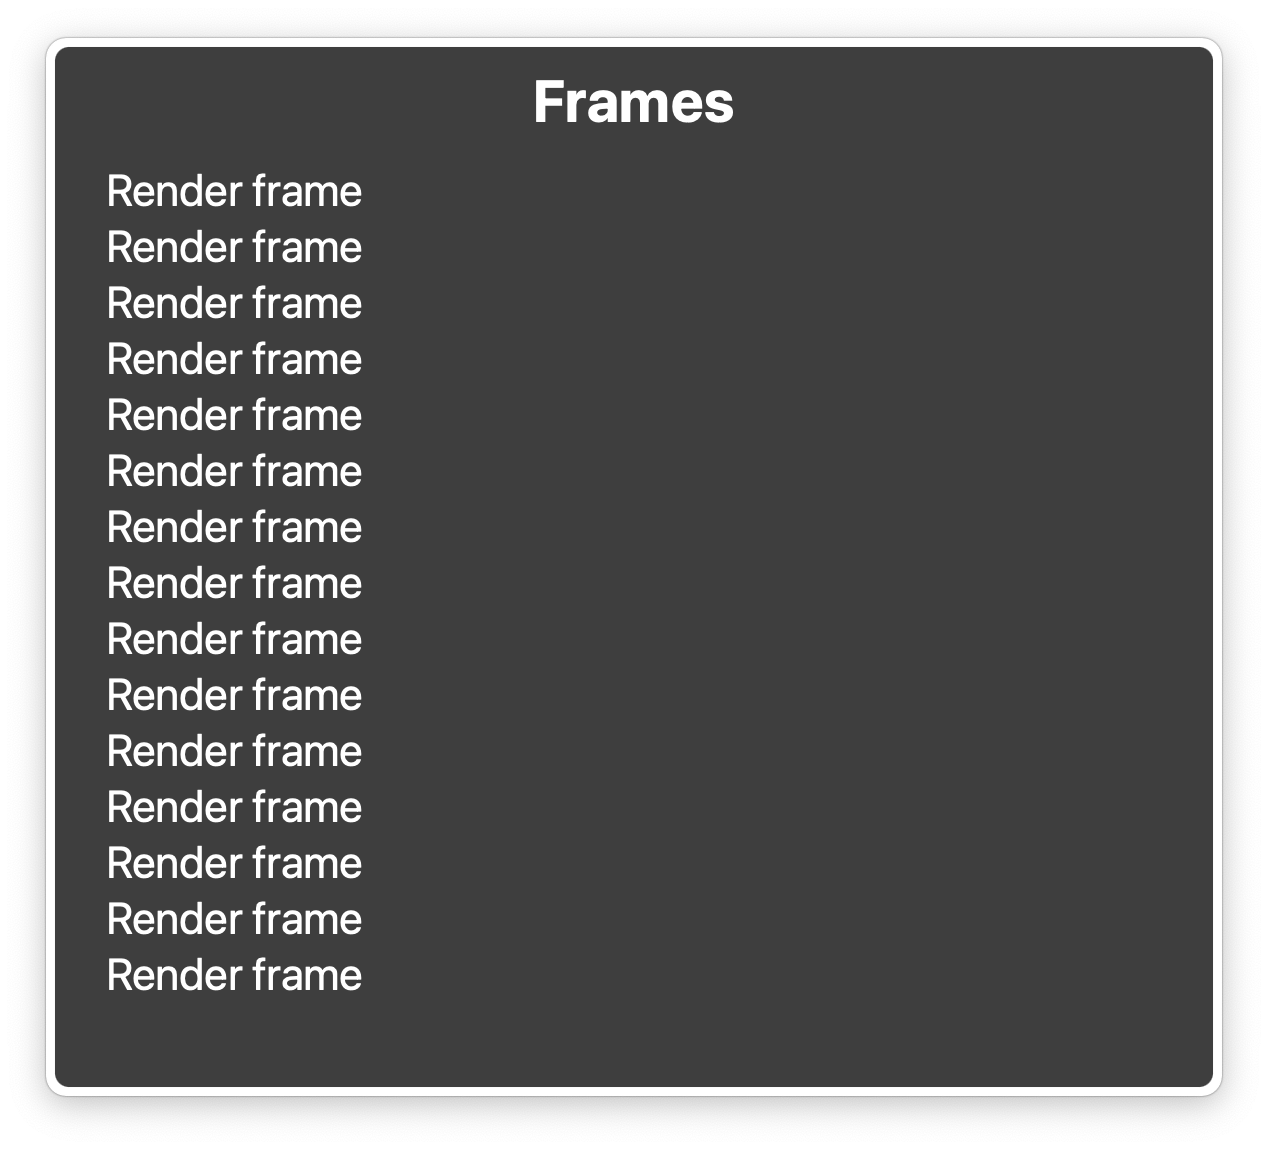
- Github places rendered mermaid diagrams into iframes. Github does not include the title attribute in these iframe tags, so if you include multiple mermaid diagrams in the same document, they will all be announced as “render frame”.
Accessible names
Mermaid gives us several ways to provide an accessible name for the SVG diagrams it produces.
The most reliable is to add a title to the front matter. This works for every type of mermaid chart, and is visible to sighted users.
```mermaid
---
title: The expected workflow
---
sequenceDiagram
%%{init: {'sequence': {'mirrorActors': false}}}%%
    actor Patron
    Patron->>Library: Goes to Library
```
results in the following:
You can also use the accTitle keyword as described in the mermaid accessibility documentation, but keep in mind that this doesn’t display on the screen.
A third option is to use the title keyword, available in some, but not all diagram types.
It has the same effect as the front matter
title described above.
Accessible descriptions
You should include a detailed text description of your chart. This is particularly important since Mermaid doesn’t provide any information about the relationships between nodes to screen readers. Without a good description, screen reader users will just get a meaningless list of the names of the chart nodes.
An easy way to do this is to simply add it in the markdown itself, outside the memaid chart – this way, all users can benefit from the description.
If you don’t want the description to display
on screen, you can have mermaid include it in
a <desc> element within the SVG by using the accDescr keyword.
Color themes
Mermaid has several color themes, each of which has some color contrast issues at the time of writing.
Fortunately, if you don’t specify a color theme, the default behavior of Github’s mermaid js
integration is pretty good. It detects if dark mode is on, and adjusts the colors in the
diagram to work well with the detected background color. However, if you specify a Mermaid
theme in your %%{init}%% block, it overrides this behavior, and typically results in a diagram
that is completely unreadable in dark mode. Unless you are willing to do some serious
customization to enhance your theme to work in both modes, do not specify a theme in the
%%{init}%% block.
Mermaid also gives you the ability to customize themes in the %%{init}%% block using the
themeVariables setting. You can use these to enhance Github’s themes without losing the
automatic dark mode behavior. Just be sure to test your custom colors with Windows High Contrast mode and a dark theme or dark mode.
Iframe
As described in the Github blog post, Github places mermaid diagrams into <iframe> elements. Unfortunately, the iframes it generates don’t have title attributes. So, in a page with several diagrams,
the list of frames is not very meaningful. When I open a document with several mermaid charts in the voiceover rotor, all of the frames are named “Render frame”.
If you do include multiple mermaid charts in the same document, confirm that the charts are integrated into a meaningful heading structure.